Solving the Winter Reliability Challenge
Written by Michael Reed & Brent Bennett
Key Points
- Because of the ERCOT grid’s heavy reliance on wind, solar, and energy storage to meet rapid demand growth, a 1-in-10-year winter storm in 2030 would result in over 40 hours of outages and excess energy costs of almost $11 billion.
- Adding 12 GW of new natural gas generation over the next 4 years, with a corresponding reduction in new wind and solar would bring the ERCOT grid into compliance with its reliability standard while keeping costs relatively constant.
- A more reliable generation mix would reduce the extent of outages during a major winter storm in 2030 by almost 90% and save $12 billion in energy costs and direct economic losses.
- The upcoming triennial reliability assessment from ERCOT provides an opportunity for the PUC and stakeholders to evaluate market reforms that better value the long-duration dispatchable generation and demand response needed to prevent future outages.
Executive Summary
The improved performance of the Electric Reliability Council of Texas (ERCOT) grid during recent winter storms in Texas has given the impression that Texas has largely solved the winter reliability problems that led to the devastating outages during Winter Storm Uri in February 2021. However, as the first paper in this series documented (Reed & Bennett, 2026), the reliability improvements due to power plant weatherization, expanded ancillary services, and enhanced emergency practices are being outweighed by a resource mix that continues to lean more heavily into solar and energy storage. Over the past five years, 10 GW of wind, 36 GW of solar, and 22 GW of energy storage have been added to the ERCOT region, along with only 4 GW of new natural gas generation (ERCOT, n.d.-a). If this investment trend continues through 2030, a 1-in-10-year winter storm would result in over 40 hours of outages.
This paper applies the same 2030 modeling regime as the first paper in this series to examine the impact of removing post-2026 wind and solar additions and replacing them with enough new gas generation to maintain a constant reserve margin. Shifting the generation mix to include more gas and less wind and solar results in stable market prices under normal weather conditions while improving the performance of the ERCOT grid during 1-in-10-year winter and summer extreme weather scenarios. In the winter storm scenario, the shift in generation reduces the magnitude and duration of outages by nearly 90%, cutting power costs by $5.6 billion and saving $6.3 billion more in direct economic losses from the outages. The additional firm generation also provides a higher reserve margin during a modeled summer heat wave without increasing overall energy costs.
Ultimately, the analysis concludes that ERCOT’s single clearing-price market structure undervalues both dispatchable generation and longer-duration demand response, contributing to underinvestment in reliability. To prevent escalating outage risks, the region must adopt market reforms that appropriately value reliable, dispatchable power generation and long-duration solutions like demand flexibility. ERCOT’s forthcoming triennial reliability assessment (PUC, 2026c) offers an opportunity to assess these options, and policymakers should make that assessment as thorough as possible.
Introduction: The Challenges Facing the ERCOT Wholesale Market
In the five years since Winter Storm Uri in February 2021, the electric grid governed by the Electric Reliability Council of Texas (ERCOT) has undergone many policy and structural changes. Power plants are now subject to winter weatherization requirements, ancillary services have been added and modified, and market operations and emergency coordination practices have been improved. There have been multiple weather events since 2021 that have tested the ERCOT grid, including a heat wave in September 2023 and several winter storms, most recently Winter Storm Fern in January 2026. The grid avoided outages during these events, demonstrating the changes during the past five years have improved the reliability of the system.
However, what has not changed since Uri are the investment patterns that directed nearly $100 billion into wind and solar generation prior to 2021 (ACPA, n.d.)1 instead of into reliable generation. Since 2021, about $60 billion (ACPA, n.d.)2 has been invested in 36 GW of solar, 22 GW of energy storage, and 10 GW of wind in Texas (ERCOT, n.d.-a). Only 4 GW of new gas generation has been built during that time (ERCOT, n.d.-a). With solar and storage comprising over 80% of the projects that are nearing completion (ERCOT, n.d.-b) and rising demand from data centers (ERCOT, 2025a, p. 13), the improved performance of the grid will not be able to overcome the fundamental shortage of reliable capacity, particularly during long-duration winter storms.
The first paper in this series (Reed & Bennett, 2026) demonstrated that if current trends continue, a 1-in-10-year summer heat wave or winter storm in 2030 will lead to multiple days of outages and billions of dollars in increased cost to consumers. The research shows that even significant additions of wind and solar capacity do not improve the situation because those resources sometimes produce almost no electricity; for example, wind and solar produced less than 10% of their total combined capacity during the peak demand period of Winter Storm Fern (Woodfin, 2026, p. 6). Even the substantial amount of energy storage expected to be added over the next few years does not provide enough long-duration capacity to cover off these outages.
What’s needed are policy changes that redirect market revenue from variable to reliable resources, instead of paying all resources a single clearing price for energy, as is currently the case in ERCOT. While a dramatic shift toward more reliable resources significantly reduces the magnitude and duration of outages during these stress scenarios in 2030, it will likely take longer than just a few years to bring the grid into compliance with the Public Utility Commission of Texas’s (PUC) reliability standard (16 TAC §25.508). What is needed is both urgent action from policymakers to mitigate this problem before it gets worse and then steady patience while the wholesale market adjusts and the system builds the reliable generation needed over the next decade to dig out of the reliability deficit that has been created over the prior decade.
Footnotes
1 This number is taken from a version of this factsheet that was posted in 2021 but is no longer available online.
2 This number is derived by taking the total given in the current version of this factsheet and subtracting the amount from the version of the factsheet that was posted in 2021.
Model Assumptions: Adjusting the Forecast Generation Mix Toward Greater Reliability
As in the first paper in this series (Reed & Bennett, 2026), the models in this paper were created using the UPlan Network Power Model (UPlan-NPM) from LCG Consulting (LCG, n.d.). The initial generation mix for the models (hereafter called the “no firming” or “non-firm” case) was provided by LCG and modified based on data from ERCOT’s December 2025 capacity, demand and reserves (CDR) report (ERCOT, 2025b). This is the same generation mix used in our previous paper (Reed & Bennett, 2026, p. 10). The installed capacities for each generation resource used in the model are shown in Table 1.
Table 1
2030 Winter Installed Capacity by Fuel Source in MW, No Firming Forecast vs. Forecasts with Policies to Add Reliable Generation
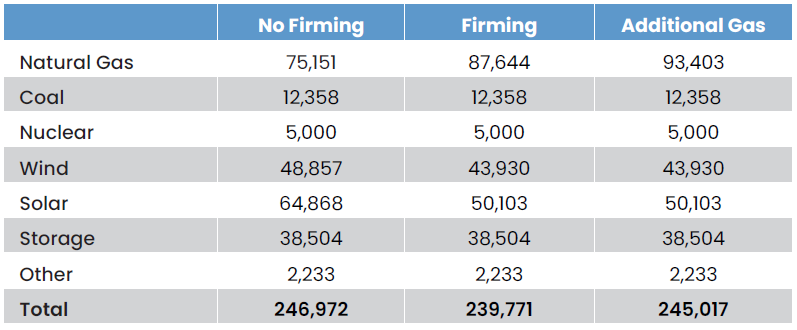
To shift the generation mix in the model from the non-firm 2030 case to a scenario that assumes policies that shift the mix of new generation from wind and solar to natural gas (this new scenario will be termed the “firm” or “firming” case throughout this paper), we removed all new wind and solar that begins commercial operations after January 1, 2027 and added enough natural gas to keep the reserve margin—the difference between the amount of firm capacity in the system and the peak demand—almost constant. That process resulted in removing 19 GW of solar and 6.5 GW of wind while adding 12.5 GW of gas.
After these modifications, the base case model (with no extreme weather scenarios) was still showing some unserved load in August, likely due to transmission constraints caused by geographic mismatches between the wind and solar that we removed and the gas we added. Notably, these constraints appear to be occurring mostly at lower voltage levels and are only slightly improved by the presence of the proposed 765-kV lines, which are included in this model. To eliminate the unserved load, we added back 25% of the wind and solar that we originally removed to arrive at the installed capacities shown in the “Firming” column in Table 1.
To test whether additional gas generation beyond the firming scenario would completely eliminate outages in the winter stress scenario and provide other benefits to the system, we added another 5.8 GW of new gas generation (see the “Additional Gas” column in Table 1) resulting in 18.3 GW more gas generation than in the no firming case. As detailed below, this additional gas generation only produced marginal improvements over the firming case during the winter storm due to limitations with our model.
The Benefits of More Reliable Generation During a 2030 Winter Storm
The first step before we assess the impact of a 1-in-10-year winter storm is to rerun the base case model without any increased demand to ensure that the change in generation mix doesn’t produce any unexpected outcomes. As shown in Table 2, the base case is purposefully designed to produce no outages (i.e., no unserved energy), such that outages only occur during the stress scenarios. The winter and summer stress scenarios use the same demand curves as in our previous work, with a peak demand of about 125 GW in the summer and 110 GW in the winter (Reed & Bennett, 2026, p. 11). In the winter stress scenario, wind and solar output are reduced by 60% and 40% during the storm compared to their output in the base case, and outages of gas and coal power plants are set to about 15% of their total installed capacity, comparable to what was experienced during Winter Storm Fern (Woodfin, 2026, p. 12).
In the non-firm cases, the winter stress scenario results in outages lasting over 40 hours, with 210 GWh of unserved load and energy costs of over $11 billion. The firming scenario produces a significant improvement, with the unserved load declining by almost 90% to 32 GWh and energy costs falling from $10.8 billion to about $4 billion during the week of the storm. Figure 1 provides a visual representation of the improvement during the winter storm, with the area plot showing the generation plus the flexible load that is deployed, the black line the total demand, and the white space in between in between area plot and the black line shows the energy that is unserved.
Table 2
Summary Results for the Non-Firm Cases
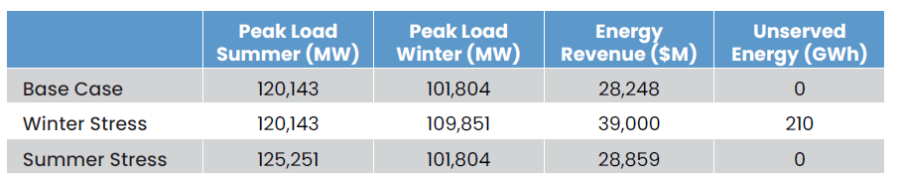
Table 3
Summary Results for the Firming Cases

Figure 1
Forecast Generation and Demand During a Long-Duration Winter Storm in 2030, Firming Case
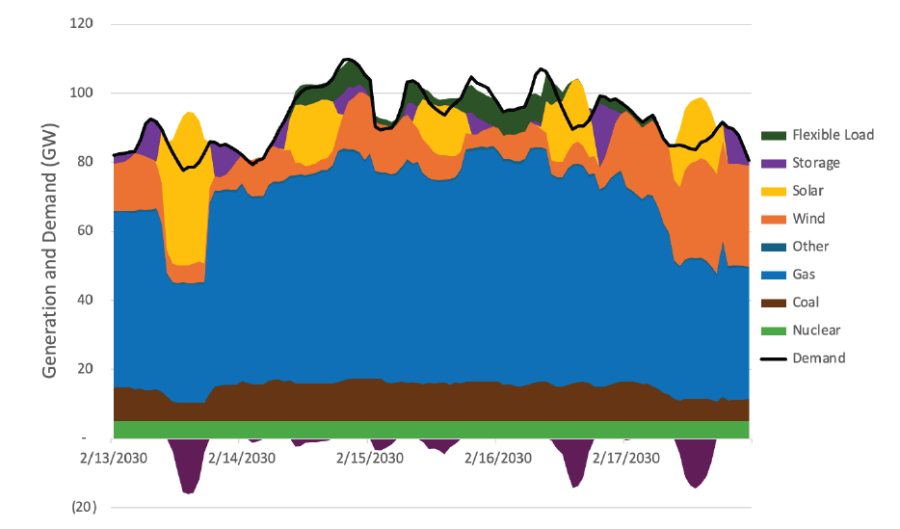
Note. The battery area on top of the generation curve indicates batteries discharging, and the battery area below the generation curve indicates batteries charging. The generation curve sits above the black demand curve during the periods when batteries are charging because the excess generation is being used to charge the batteries. This same convention is used in Figure 2.
In this case, the duration of the outages is still close to about 40 hours, which exceeds the parameters set forth in the PUC’s reliability standard (16 TAC §25.508), but the magnitude drops significantly, from 18 GW without firming to 8 GW with firming. During most of the hours in which outages occur, the amount of power short is less than 1 GW, indicating that the outages are isolated in one or two regions of ERCOT and that most customers across Texas will still have power at those times. The amount of energy curtailed by flexible load also dropped by about 80 GWh compared to the non-firm case, indicating that prices were not as high through the entirety of the storm thanks to the extra firm generation.
It is important to point out that not all of the available thermal generation in the model is being fully utilized during the winter storm, and if it was used optimally, the ERCOT system would be able to avoid outages entirely under the firming scenario. The problem is that transmission constraints and suboptimal geographic placement of generation and transmission in the model are preventing all of the generation from being used. In the real world, where market participants optimize the placement of new generation based on nodal prices, we expect these geographic issues would be less of a problem, and the benefits of firming would likely be better than what the model is able to show. But optimizing the UPlan model in this way is very difficult and outside the scope of this paper (see the sidebar for more explanation).
Sidebar: Modeling the Location of Generation and Transmission in ERCOT
One problem with the UPlan-NPM developed for this paper is the presence of transmission congestion in both the winter and summer stress scenarios, even though the model includes all of the 765-kV long-distance transmission lines in ERCOT’s latest regional transmission plan (ERCOT, 2025a, p. 14), which are designed to help alleviate this exact problem. In the winter storm with firming, natural gas generation never exceeds 68 GW despite almost 75 GW being available, and the summer, it never exceeds 69 GW despite 82 GW being available. A couple GW of coal is also consistently curtailed in the summer.
Also, the hourly ERCOT-wide average price only reaches the $5,000/MWh price cap for one hour in the winter storm with firming (see Figure 3) and never in the summer. This is evidence that the unserved load seen in Figure 1 is localized, with prices hitting the cap in regions that are short while the rest of the ERCOT region is seeing more normal price behavior. Under this scenario, ERCOT would probably initiate local load shedding, rather than systemwide rolling outages, and the outages would not be experienced by everyone in the ERCOT region. The mismatch of demand and supply across different regions also partially explains why flexible load is being deployed even at times when the thermal generation fleet is not being fully utilized.
While putting more transmission into the model would help alleviate this congestion, this problem is not definitive evidence that more transmission is needed in reality (recall that the model includes the 765-kV lines and a lot of new transmission compared to the system today). The congestion is mostly a product of sub-optimal placement of new generation in the model, which must be done manually with a fair amount of guesswork, relative to the existing transmission network, which was optimized for the model’s original generation mix and not our new mixes. In the real ERCOT grid, generators carefully consider demand, nodal market prices, and transmission congestion to optimize the location of each new power plant to a degree that is impossible to achieve in this model environment. In other words, most of the congestion in our model is likely a result of the model’s limitations and may not exist in the real world.
The model results also indicate that local upgrades at lower voltages (345-kV and below) are more critical to serving near-term demand than the 765-kV lines, which are more of a long-term play to resolve problems beyond 2030. However, as previous work from our team has shown (Bennett, 2026b), meeting the long-term reliability needs of the ERCOT region with more thermal generation, instead of more wind and solar as ERCOT’s base case models currently assume, would allow the 765-kV projects to be significantly reduced or avoided entirely. Our fundamental conclusion from all of this work is that market reform to get more thermal generation on the ERCOT grid would both improve grid reliability and reduce future transmission needs.
Although this work shows it is possible in theory to change the generation mix to meet the reliability standard by 2030, the time required for policy changes to take effect and for new generation to get built severely constrains the ability to make these rapid changes in practice. The only other option to meet the reliability standard by 2030 while adding more demand is to reduce system demand during the peak hours. As demonstrated in our previous series on winter reliability, a roughly 5 GW reduction in demand on top of the extra reliability provided by the firming of the generation fleet is enough to enable compliance with the reliability standard (Bennett, 2026).
However, while demand response can provide a reliability boost in the short run, over the long run, supply must eventually rise to meet whatever the expected peak demand is. Consistent use of demand response will cause prices to converge to whatever the expected peak demand is, with or without flexible demand. In other words, demand flexibility is a useful tool for providing reliability, but it is not by itself a panacea for a market design that misprices reliability, as the ERCOT market is doing right now. The only permanent cure to this problem is to properly price reliable generation to meet expected peak demand.
The Impact of More Reliable Generation on Summer Outage Risk
As in the winter stress scenario, the summer stress scenario uses the same demand curve as in Part 1 of this series (Reed & Bennett, 2026, p. 11), with a peak demand of about 125 GW. The generation mix is then adjusted in the same manner as in the winter scenario, except that the solar and wind generation curves and thermal power plant availability are not adjusted downward during the heat wave as they were during the winter storm.
Figure 2
Forecast Generation and Demand During a Summer Heat Wave in 2030, Firming Case
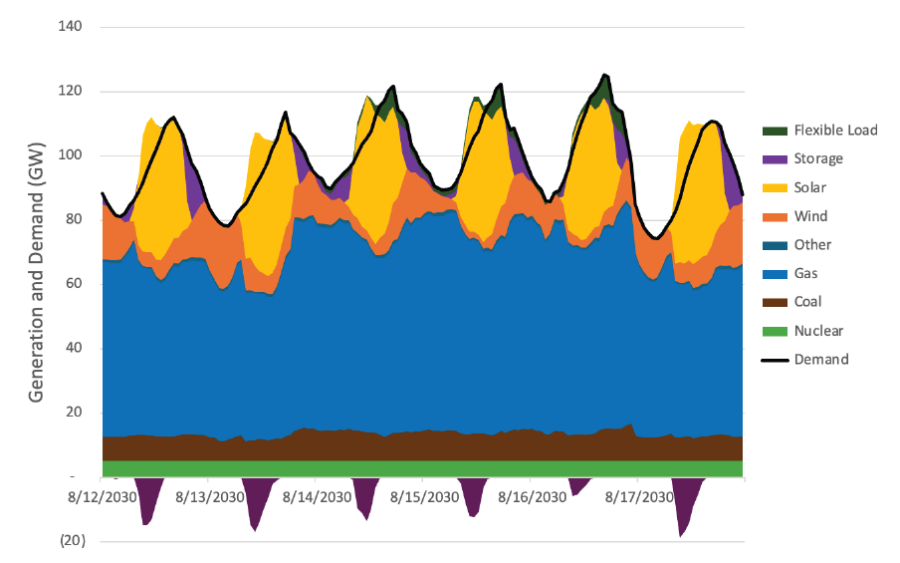
As described in Part 1 of this series (Reed & Bennett, 2026, p. 14), the deployment of flexible load was needed to prevent outages during the summer stress scenario. Flexible load is also used in this case, but the quantity used drops slightly, from 232 GWh to 199 GWh, because there is sufficient thermal generation to cover off the overnight hours. In fact, there is enough generation capacity to cover all hours in this scenario without using flexible load, but the uneven distribution of solar across Texas and transmission congestion between different parts of the ERCOT grid means that some regions are still short of power in the afternoons. Also, some of the flexible load has a lower strike price than some of the highest priced gas and storage, and as a result, it deploys before the generation resources.
One other point that Figures 1 and 2 make clear is that energy storage is more effective when used as a marginal, short-duration resource instead of a long-duration resource. All of the batteries in the 2030 model, over 38 GW of installed capacity, can only store about 75 GWh of energy, which is roughly equal the output of a 1 GW gas plant for the 3-day duration of the winter storm. The extra 12.5 GW of gas in the firming scenario produced about 500 GWh of energy during the modeled winter storm. Replacing that output with batteries, assuming the batteries come into the storm with full charge and perform optimally, would require $100 billion of batteries (assuming $200/kWh battery cost). However, when batteries have sufficient time to charge with excess generation, they can cover off many short-duration outages by using their capacity several times over. This is why batteries are more effective during summer stress scenarios, where they can charge during the early-morning hours when demand is lower and there is excess solar on the grid.
Effects of Adding More Gas Generation Than the Firming Scenario
Notably, the firming case has enough available thermal capacity, about 92 GW after accounting for outages, to meet the peak net load (demand minus wind and solar generation) for all but 13 hours during the modeled winter storm, with a maximum deficit of 9 GW. If this generation was being fully utilized, along with the existing energy storage and flexible load, the system should be able to avoid outages entirely. However, the maximum amount of thermal generation dispatched during the storm is only 84 GW. To test our theory this problem was being caused by misalignments between the location of the new demand and generation in the model, combined with transmission constraints, we added more gas generation beyond the 12.5 GW added in the firming scenario in an attempt to eliminate all unserved load during the winter storm.
Table 4
Summary Results for the Winter Stress Case for the No Firming, Firming, and Additional Gas Cases

We added up to 5.8 GW of new gas generation and still could not fully eliminate the unserved load, with about 17 GWh going unserved during the storm and many hours showing just a few hundred MW of outages. In fact, the maximum amount of thermal generation dispatched only rose by about 1.7 GW, so only a third of the new additions were actually being used. This proved our hypothesis that the suboptimal geographic matching of generation and demand in the model is causing the unserved load in the firming scenario, not an overall shortage of power. In the real world, more optimal placement of generation and transmission would result in better outcomes for the firming scenario because more of the firm power would actually be used.
The change in prices when moving from the non-firm generation mix to the firm mix is significant, with the average real-time price falling from $942/MWh to $388/MWh during the week of the winter storm. Adding more gas generation drops the average energy price during the week to only $289/MWh. By eliminating the extent of outages and reducing scarcity across many regions, the firm generation keeps the systemwide average price below the $5,000/MWh price cap, even when some regions are still short and experiencing outages. In the firming case, the systemwide average price is above $1,000/MWh for only 14 hours and only hits the price cap for one hour (see Figure 3), and with more gas generation beyond the firming case, the systemwide average price is above $1,000/MWh for only 9 hours.
Figure 3
Real-Time Energy Prices During the Winter Stress Scenario, for the No Firming, Partial Firming, and Full Firming Cases
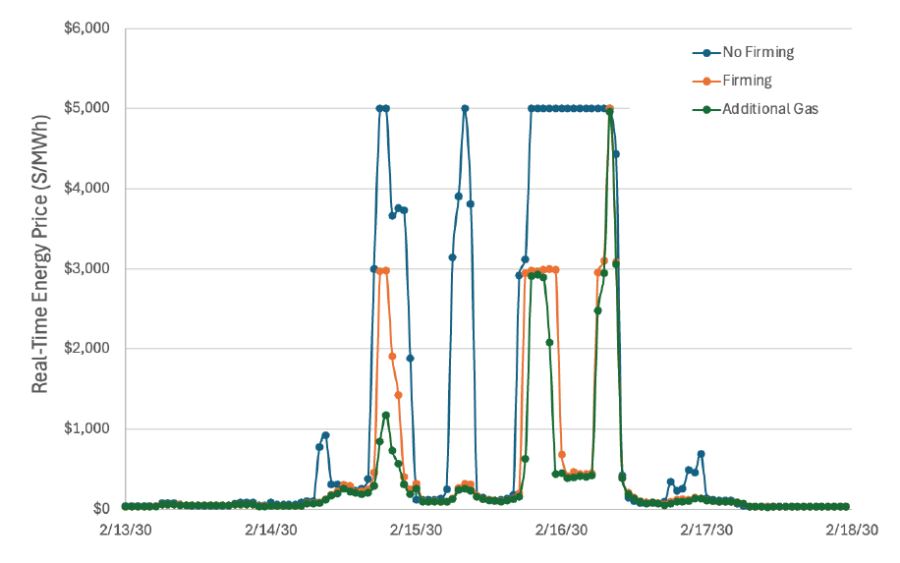
Another important point that must be considered is not just the change in energy prices but the overall economic losses due to outages. Ignoring those losses heavily skews any analysis toward undervaluing reliability (Orr & Rolling, 2026). Because the amount of unserved load is reduced by almost 90% in the firming scenario and slightly more than that in the additional gas scenario, both scenarios significantly reduce the total economic costs of the storm. Taking the PUC’s value of lost load, which is currently set at $35,000/MWh (PUC, 2024), as a proxy for direct economic losses, the total value of the unserved energy would be $7.4 billion in the no firming case, $1.1 billion in the firming case, and, of course, zero in the case with additional gas generation that incurs no outages.
Conclusion
Over the past decade, the ERCOT region has been moving into a regime where peak demand begins to substantially outstrip firm supply, and with demand increasing rapidly over the next few years, the situation is quickly reaching a critical juncture where even minor winter storms could lead to significant outages. The main conclusion of this research is that the more intermittent resources are relied upon to meet demand during extreme weather situations, especially in the winter, the higher the risk of longer and deeper outages. In addition, energy storage is of limited usefulness during long duration storms when there is no opportunity to recharge and the storage capacity can only be used once.
This grim conclusion should not overshadow the fact that wind and solar can be useful marginal resources if the energy output is correctly priced in the wholesale market. The problem is that the single clearing price for energy, which is the premise on which the ERCOT wholesale market is designed, does not properly value the difference between dispatchable and intermittent resources. Whatever resources are producing at any given time are paid the same market price. To make matters worse, because the lowest marginal cost resources are dispatched first, wind and solar generators are able to bid almost all of their power into the market (subject to transmission constraints) while gas and coal generators are pushed to the side, unable to count on consistent market revenue and forced to endure costs from ramping up and down to balance wind and solar output.
The other problem that must be addressed—which this research makes even more clear than our prior work did—is that the single clearing price does not value the difference between long- and short-duration resources. A battery is paid the same price as a gas generator for the power it puts into the system even though the battery may not be able to discharge at that same rate during the next hour or at the same time the following day. A gas generator, on the other hand, can reliably be counted on to produce the same power across all hours.
Similarly, there is no price signal for long-duration demand reductions from large consumers, even though our research makes it clear that such responsiveness is likely necessary in the near-term to avoid outages and, if priced appropriately relative to reliable generation, can also help reduce volatility and improve reliability in the long-term. In this context, the large load demand management service (PUC, 2026a), which the Texas Legislature mandated last year (SB 6, 2025, pp. 9-11), the large load interconnection standards currently under consideration (PUC, 2026b), and planning guide revisions to help ERCOT incorporate a higher proportion of controllable loads (Sharma Frank, 2025) all present opportunities to create helpful tools for closing the reliability deficit if the programs are designed and sized appropriately.
The upcoming triennial reliability assessment from ERCOT (PUC, 2026c) is likely to show that the region will fall short of the PUC’s reliability standard in a few years, given that recent modeling work by ERCOT staff and consultants (Collins, 2025, p. 3) is largely in agreement with the assessment provided by this paper. By rule, if the reliability assessment determines that a deficit exists, ERCOT is required to present a menu of market reform options for closing that deficit, and the PUC is required to assess those options (16 TAC §25.508). This process will present a timely opportunity to pick up where previous market reform discussions have ended, and it must be taken seriously by the PUC, ERCOT, and market participants.
As part of these deliberations, the PUC should reopen its reliability requirement for new generation and, as we have recommended before (TPPF, 2025), set a strong enough penalty so that generators will be incentivized to buy new firm capacity. The 90th Texas Legislature should also take up again legislation (see SB 715, 2025 and HB 3356, 2025) that would apply this reliability requirement to existing wind and solar generators while providing better incentives for reliable generation. A strong reliability standard that requires variable wind and solar to participate in the market on equal footing with reliable generation would go a long way toward meeting the goals outlined in this paper. Future work in this series will assess the efficacy of this specific reform and other market reform options to reduce electricity costs for Texans and the likelihood of severe winter outages.
References
American Clean Power Association (ACPA). (n.d.). Texas state fact sheet in Clean power state-by-state (webpage). Retrieved January 20, 2026, from https://cleanpower.org/facts/state-fact-sheets/
Bennett, B. (2025a, December). Fool me twice: Why the Texas grid is still vulnerable to winter storms, Part 1: The evolution of the Texas grid since Winter Storm Uri in 2021. Texas Public Policy Foundation. https://www.texaspolicy.com/wp-content/uploads/2026/02/2025-12-Texas-Grid-Still-Vulnerable-Part-1-Bennett.pdf
Bennett, B. (2026a, February). Fool me twice: Why the Texas grid is still vulnerable to winter storms, Part 3: How Texas can solve its winter reliability problem. Texas Public Policy Foundation. https://www.texaspolicy.com/wp-content/uploads/2026/02/2026-02-Texas-Grid-Winter-Resiliency-Part-3-Bennett.pdf
Bennett, B. (2026a, June). An economic assessment of the 765-kV Strategic Transmission Expansion Plan and alternative approaches to enable cost-effective growth. Texas Public Policy Foundation. https://www.texaspolicy.com/wp-content/uploads/2026/06/2026-05-LP-Strategic-Transmission-Expansion-Plan-Bennett-combined.pdf
Reed, M. & Bennett, B. (2026, June). Forecasting the future of the ERCOT grid, Part 1: The ongoing winter reliability challenge. Texas Public Policy Foundation. https://www.texaspolicy.com/wp-content/uploads/2026/06/2026-05-LP-Future-ERCOT-Grid-Part1-ReedBennett-1.pdf
Collins, K. (2025, November 11). Letter to the Public Utility Commission of Texas in Project No. 55797.
https://interchange.puc.texas.gov/Documents/55797_10_1556589.PDF
Electric Reliability Council of Texas (ERCOT). (n.d.-a). Capacity changes by fuel type charts September 2026 in Resource adequacy (webpage). Retrieved October 20, 2026, from https://www.ercot.com/gridinfo/resource
Electric Reliability Council of Texas (ERCOT). (n.d.-b). GIS_Report_December2025 in GIS report (webpage). Retrieved January 20, 2026, from https://www.ercot.com/mp/data-products/data-product-details?id=pg7-200-er
Electric Reliability Council of Texas. (2025a, December). Report on existing and potential electric system constraints and needs. https://www.ercot.com/files/docs/2025/12/23/2025-Report-on-Existing-and-Potential-Electric-System-Constraints-and-Needs.pdf
Electric Reliability Council of Texas (ERCOT). (2025b, December 19). Report on the capacity, demand and reserves (CDR) in the ERCOT Region, 2026-2030. https://www.ercot.com/files/docs/2025/12/19/CapacityDemandandReservesReport_December2025.pdf
HB 3356. House Committee Report. 89th Texas Legislature. Regular. (2025). https://capitol.texas.gov/tlodocs/89R/billtext/pdf/HB03356H.pdf
HR 1. 119th Congress (2025). An act to provide for reconciliation pursuant to title II of S. Con. Res. 14.
https://www.congress.gov/bill/119th-congress/house-bill/1/text
Lazard. (2025). Levelized cost of energy+. https://www.lazard.com/media/eijnqja3/lazards-lcoeplus-june-2025.pdf
LCG Consulting. (2024). UPlan network power model. http://www.energyonline.com/Products/Uplane.aspx
Orr, I. & Rolling, M. (2026, May). Introducing the social cost of blackouts. Always on Energy Research. https://www.aoenergy.org/wp-content/uploads/2026/05/Introducing-the-Social-Cost-of-Blackouts_May2026_AlwaysOnEnergyResearch.pdf
Public Utility Commission of Texas (PUC). (2024). Public Utility Commission of Texas adopts reliability standard for the ERCOT market [press release]. https://ftp.puc.texas.gov/public/puct-info/agency/resources/pubs/news/2024/PUCT_Adopts_Reliability_Standard_for_the_ERCOT_Market.pdf
Public Utility Commission of Texas (PUC). (2026a). Project No. 58482: Large load demand management service. https://interchange.puc.texas.gov/search/filings/?UtilityType=A&ControlNumber=58482&DocumentType=ALL&SortOrder=Ascending
Public Utility Commission of Texas. (2026b). Proposal for publication of new 16 TAC §25.194 in Project No. 58481.
https://interchange.puc.texas.gov/Documents/58481_122_1600475.PDF
Public Utility Commission of Texas. (2026c). Project No. 58777: Triennial reliability assessment for the ERCOT Region under §25.508.
https://interchange.puc.texas.gov/search/filings/?UtilityType=A&ControlNumber=58777&DocumentType=ALL&SortOrder=Ascending
Texas Administrative Code. (n.d.). Title 16, Part 2, Chapter 25, Rule 508: Reliability standard for the Electric Reliability Council of Texas (ERCOT) region.
https://ftp.puc.texas.gov/public/puct-info/agency/rulesnlaws/subrules/electric/25.508/25.508.pdf
Texas Public Policy Foundation (TPPF). (2025, September 2). Texas Public Policy Foundation’s comments on proposed TAC §25.65 in Project No. 58198. Public Utility Commission of Texas. https://interchange.puc.texas.gov/Documents/58198_65_1535661.PDF
SB 6. Enrolled. 89th Texas Legislature. Regular. (2025). https://capitol.texas.gov/tlodocs/89R/billtext/pdf/SB00006F.pdf
SB 715. Senate Committee Report. 89th Texas Legislature. Regular. (2025). https://capitol.texas.gov/tlodocs/89R/billtext/pdf/SB00715S.pdf
Sharma Frank, A. (2025). 134PGRR-01 Interconnection studies reform for dispatchable loads 110125 in PGRR 134: Key Documents (webpage). Electric Reliability Council of Texas. https://www.ercot.com/mktrules/issues/PGRR134#keydocs
Woodfin, D. (2026). System operations update. Electric Reliability Council of Texas. https://www.ercot.com/files/docs/2026/02/04/9.3-System-Operations-Update-REVISED.pdf