Violent crime is mounting in America. Many reasons—excuses, mostly—have been proffered for this: COVID-19 lockdowns, unemployment, the Defund the Police movement and its budgetary fruits, largely tolerated urban looting and rioting, police reluctance to enforce the law in high-crime areas for fear of being accused of civil rights violations, and soft-on-crime leftist prosecutors.
The ramifications of this rise in crime are being felt largely by the urban poor and may yet generate political fallout for the largely leftist elite who run most of America’s major cities today. Let’s examine the conditions giving rise to that possibility.
Crime in America
First, some background on crime in America. The FBI reports crime in two major buckets: violent crime and property crime. Violent crimes involve force or threat of force, including murder and nonnegligent manslaughter, rape, robbery, and aggravated assault. Property crimes are defined as burglary, larceny-theft, motor vehicle theft, and arson—with no force or threat of force against the victims.
The violent crime rate peaked in 1992 at 758 crimes per 100,000 people. It moved down fairly consistently until 2014, when the violent crime rate bottomed out at 362, less than half of the level of violent crime 22 years earlier. Violent crime crept back up to 387 in 2016, and then moved down for the first three years of the Trump presidency to 367 in 2019. Final 2020 numbers have not been released.
The most recent violent crime victimization surveys indicate that for every 1,000 people aged 12 and older, there were 21.0 reported violent crimes in 2019. By race and ethnicity, this broke down to a rate of 21.0 for non-Hispanic whites, 18.7 for non-Hispanic blacks, 21.3 for Hispanics, and 7.5 for Asian, and 66.3 for other (Native Hawaiians and Other Pacific Islanders, American Indians and Alaska Natives, and persons of two or more races).
Property crimes are sometimes referred to as quality-of-life crimes. In 1992, the national property crime rate was 4,904 offenses per 100,000 people. By 2019, the property crime rate had declined to 2,110.
Property crime victimization reports show that property crime was 125 percent more common in urban areas than in rural areas, with suburban areas in between. The reported rates per 1,000 households were 153.0 per 1,000 in urban areas, 110.8 in suburban areas, and 68.1 in rural areas in 2019. Property crimes have a disproportionate effect on the poor in urban areas, preventing the accumulation of capital and discouraging job-creating investment. Wealthy urbanites can pay for their own security measures or move out of high-crime areas.
Some Basic Statistics About Policing and Crime
As of 2019, there were 1,003,270 full-time law enforcement employees in America, according to the FBI, of whom almost 700,000 were sworn officers. There are wide variations in policing nationwide due to population density, tradition, and need, with the Middle Atlantic region (New Jersey, New York, and Pennsylvania) having the highest per capita level of law enforcement, 4.0 employees per 1,000 residents, almost double that of the Pacific region (Alaska, California, Hawaii, Oregon, and Washington) at 2.1 employees per 1,000 residents.
One might presume there are more law enforcement personnel in high-crime cities, but there is little correlation. Some cities have high crime rates and robust law enforcement numbers, and some have high crime rates and a thin blue line.
For instance, Kansas City, Missouri, the U.S. murder rate capital., employs 3.7 law enforcement personnel per 1,000 residents. In 2019, there were 1,431 violent crimes reported per 100,000 people in Kansas City while the property crime rate was 3,856. This compares to the national average of 3.5 law enforcement personnel per 1,000 people with a national violent crime rate of 367 per 100,000 people and a property crime rate of 2,110.
The table below highlights some cities that were in the news during much of 2020 for protests, riots, looting, and arson. It compares them to other major cities that largely escaped significant unrest, comparing their levels of law enforcement, violent crime, property crime, and the ratio of law enforcement to those crimes, essentially providing a measure of the number of crimes committed per law enforcement personnel.
Of note, three of the cities noted for persistent and damaging unrest—Minneapolis, Portland, and Seattle—had a volatile combination of law enforcement staffing levels far below the national average paired with property crime rates more than double the national average—in 2019, a year before widespread unrest broke out.
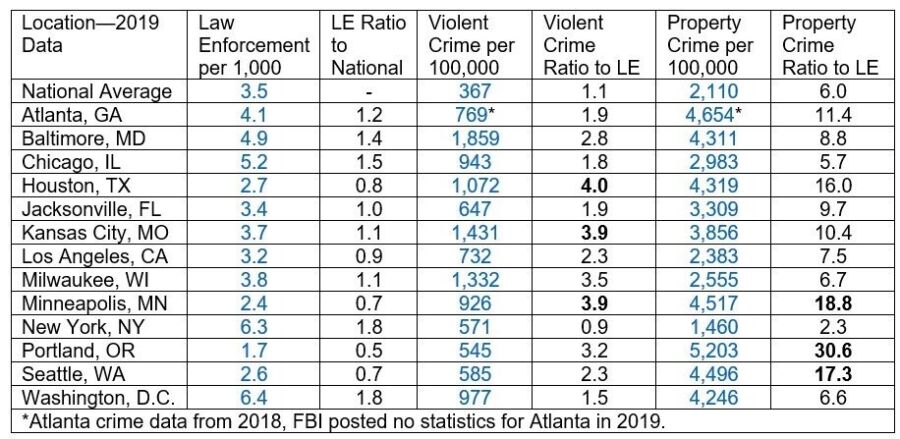
Thus, from a practical standpoint, Minneapolis, Portland, and Seattle had already defunded the police by 2019. That all three cities were constantly in the news throughout 2020 makes more sense when understanding that, from a policing standpoint, local political leaders had already surrendered to lawlessness.
In Seattle’s case, it should be completely unsurprising that the Capitol Hill Autonomous Zone (CHAZ) later known as the Capitol Hill Occupied Protest (CHOP) would fester in a city that had police staffing levels at 70 percent of the national average. Portland, the site of the persistent Antifa siege of a federal courthouse and other government buildings, employed half of the national average of law enforcement personnel, while seeing the highest ratio of property crimes per law enforcement staff of the 13 cities examined.
How many police there are, how they are trained, equipped, and deployed, and the level of trust they enjoy with the public largely drives law enforcement’s ability to solve crimes. This is known as the crime clearance rate.
Of the violent crimes known by law enforcement, only 45.5 percent were cleared by arrest of a suspect in 2019, with 61.4 percent of murders resulting in an arrest. The closure rate for property crime that year was a dismal 17.2 percent nationally, meaning if you had your stuff stolen, there was about a one-in-six chance police might arrest the perpetrator. In cities of 1 million or more, the odds of seeing justice for stolen goods drops to 11.6 percent, or about one-in-nine.
What Happens Next?
With police increasingly seeing their profession under assault while politicians seek to appease protesters, law enforcement retirements and resignations have surged. From April 2020 to March of this year, retirements increased 45 percent from the prior 12-month period with resignations up 18 percent. Hence, even if some cities wanted to maintain or increase their police force, they may have to find even greater numbers of new recruits to make up for the loss of veteran officers.
Mayors and city council members in urban areas beset with rising crime and unrest may take three possible paths. They can ask for outside assistance—such as federal law enforcement or National Guard soldiers—to supplant overtasked police departments. They can double down on defunding the police. Or they can reverse course, whether voluntarily or by being thrown out of office and their replacements changing policy.
Baltimore, Maryland offers an example of asking for outside help. Baltimore suffers from a violent crime rate some five times the national average. Its leaders are now calling for federal help to make up for their faulty management. Baltimore police announced in late July they would ask for 100 federal agents to make up for a police department that is short 392 officers, 14 detectives, and another almost 200 support staff. In 2019, the city employed 2,940 law enforcement personnel.
Exactly one year earlier, Baltimore City State’s Attorney Marilyn Mosby penned an op-ed for the Washington Post in which she warned President Trump she would prosecute any “militarized federal agents (sent) to Baltimore City to attack our citizens by making illegal arrests, kidnapping people, (or) assaulting them…” What a difference a year makes. Mosby and her husband are now under a federal criminal investigation for financial wrongdoing, having bought two homes in Florida since last September for more than $1 million.
Portland offers a cautionary tale on doubling down. Last summer, its city council cut $15 million from the police department while zeroing out the gun-violence team’s 38 positions. Murders are now on track to exceed the city’s record high of 70 killings set in 1987. The city now wants to bring back the gun-violence squad, but only four police officers have applied to work on the new 14-member team whose required qualifications include the ability to fight systemic racism. In the meantime, mostly minority Portlanders are being killed.
Lessons from the Los Angeles Riots
The city of Los Angeles in the wake of the 1992 L.A. riots offers the most dramatic example of a city changing course, although perhaps the events of 1992 during the height of America’s crime wave are of a different nature than today’s challenges. Due in equal parts to the advent of social media and the fading of time, however, most Americans likely think 2020’s unrest was far worse than what occurred over six days in Los Angeles in April and May of 1992.
In summer 2000, more than 62,000 National Guard members were deployed in response to unrest in more than 30 states and 200 cities, including Washington, D.C. Property damage in the first two weeks of violence starting May 26 totaled $1 to $2 billion in insured losses with some 14,000 arrested by the end of June.
By comparison, the 1992 L.A. riots saw 12,111 arrests with $1.8 billion of property damage in inflation-adjusted dollars. In addition, 10,000 National Guard troops were deployed to help restore order, with an additional 3,500 active-duty forces brought into the L.A. area. In other words, the six days of violence and destruction in Los Angeles in 1992 was about equal to the paroxysms of rioting, looting, and arson over the two most intense weeks nationwide in 2020.
So, what happened in L.A.? In 1992, Los Angeles suffered its worst year of violent crime. There were calls to reform the Los Angeles Police Department (LAPD)—and to significantly increase its numbers.
A year after the riots, Los Angeles elected its first Republican mayor in 32 years with Richard Riordan calling to increase the LAPD by 40 percent over five years. While the Democratic supermajority on the city council resisted Riordan’s efforts to expand the LAPD, the force did in fact grow from 7,600 in 1993 to 12,954 in 2019, an increase of 70 percent, while the city’s population expanded by only 12 percent over the same period. This increased the force patrolling the city from about 2.2 law enforcement personnel per 1,000 people in 1993 to 3.2 per 1,000 in 2019.
New York City’s recent mayoral primary offers hope that voters may turn things around themselves. Eric Adams, a former police captain, narrowly won the Democratic nomination for mayor while voicing opposition to defunding the police. Running as a centrist, Adams beat out New York Times-endorsed Kathryn Garcia, Maya Wiley, the Rep. Alexandria Ocasio-Cortez-approved candidate, Andrew Yang, and others.
Adams faces Republican Curtis Sliwa, the founder of the Guardian Angels, in the general election in November. Adams’s victory will continue New York City’s traditional robust financing of a police department with a per capita staffing level 80 percent above the national average. The violent crime rate in New York was 56 percent higher than the national average, but still far below most major cities.
The Defund the Police movement will inevitably collide with the reality of rising crime in elections through 2022. Results at the local level will be uneven. Nationally, however, Democrats who don’t unequivocally support law enforcement will face strong electoral headwinds from voters of every race and ethnicity who prize their own safety above rhetoric.