Continuing a series of California and Texas comparisons, this piece examines the two most-populous states’ key wellbeing indicators.
More than one in every five Americans calls California or Texas home.
For decades, California has been America’s bellwether—if you don’t believe it, just ask Californians. From Hollywood to Silicon Valley to the state’s politicians and public policies, what happens in California doesn’t stay in California.
Texas, on the other hand, may be brash, but it doesn’t suffer from the pretension that the rest of the nation must follow its model of lower taxes and more freedom.
California didn’t always hew to a collectivist mindset. In the late 1970s, California and much of the American West sparked the Sagebrush Rebellion—a rugged libertarian revolt against a Washington that was too powerful to be trusted and too far away to know what it was doing. California’s Proposition 13 property tax limitation passed in 1978 and soon after, the state’s most famous former governor, Ronald Reagan, was elected President in 1980.
Eventually, California’s libertarian ideal corroded, atomized by its more libertine inclinations. Newly-arrived residents, cut loose from kin and community, were drawn to surf and sunshine at the expense of faith and family. As California’s civil institutions withered, people increasingly turned to government.
California’s final turn towards collectivism happened—paradoxically—with the Cold War’s end and the collapse of the collectivist Soviet Union.
As the state’s once-robust defense industry downsized, consolidated and moved out of state, hundreds of thousands of highly-skilled machinists and engineers were laid off or relocated. The junior electrical engineers and software writers were often the first to go. Many of them soon started their own ventures.
Silicon Valley, already an emerging presence, had, up until that time, been overshadowed by the aerospace industry. But, by 1995, what was once known as DARPANET was commercialized and the modern Internet was born, begetting Amazon, Google, eBay, and others.
The dynamic convergence of talent, university-based research and venture capital created entire industries and enormous wealth in an astoundingly short period.
California excelled at creating stuff and the ability to get that stuff to people. But, the purpose of stuff isn’t more stuff, it’s people—people who sell it, buy it, use it and benefit from it (or suffer from the use of it).
While California reigns supreme at inventing the ethereal, Texas makes the material: oil, gas, chemicals, and, surprisingly, more high-tech equipment and exports than even California.
Culture is upstream from politics, though politicians can amplify cultural trends. Hollywood and church are, in the long run, more powerful than Congress.
With that in mind, how are the basic measures of human wellbeing in the two most consequential states?
A review of U.S. Census Bureau data provides illumination.
While California has produced a sizable crop of billionaires in the past 20 years, it has also led the nation in poverty. The Supplemental Poverty Measure, unlike the Official Poverty Measure, takes into account a state’s cost-of-living as well as a wider array of government benefits and costs, such as taxes and transportation. By this more comprehensive measure of basic human wellbeing, California has the nation’s highest poverty rate—19% in the years 2015-17. In Texas, 14.7% were estimated to live in poverty. Proportionately, California’s poverty rate is 29% higher than Texas’.
Poverty in America can be statistically linked to many factors: race, ethnicity, citizenship, education, and single parent households can all be determinative of general poverty levels even while individuals rise out of poverty through hard work and determination. As such, poverty is a basic barometer of wellbeing, as so many factors in society at large contribute to people avoiding poverty.
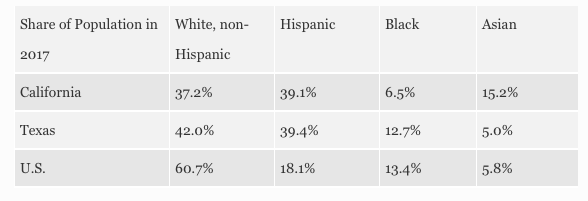
Both California and Texas are majority-minority states, two of four alongside Hawaii and New Mexico. Census estimates the following demographic composition for the four largest categories in 2017:
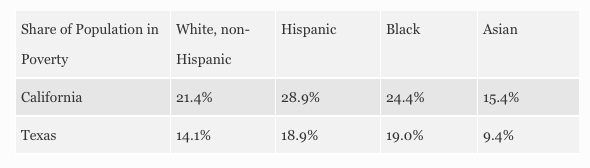
Drilling down into the data for Supplemental Poverty by race and ethnicity using the University of Minnesota’s census database tool (IPUMS-CPS) for the survey years 2014 to 2017, ages 0-64, shows the following for the four main demographic groups:
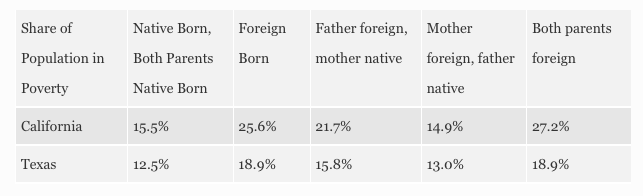
Looking at Supplemental Poverty again, using the same variables to compare how people are doing depending on where they or their parents were born shows:
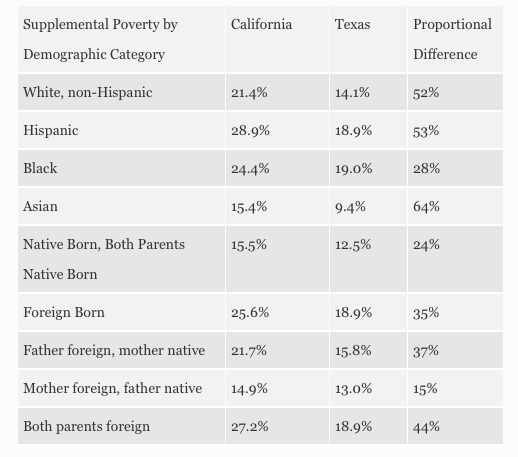
Comparing California’s poverty rates proportionately to Texas’ for the demographic factors listed above shows a huge and consistent statistical difference in Texas’ favor. Regardless of race, ethnicity, or where people or their parents were born, Californians are far more likely to live in poverty:
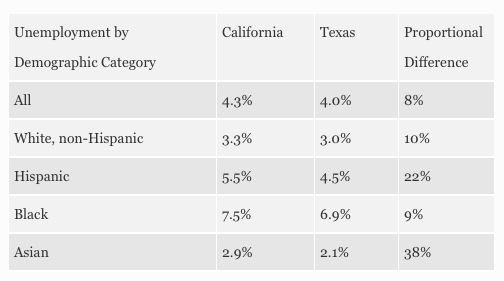
Unemployment is a significant predictor of poverty, far more so than the amount and availability of welfare benefits. The unemployment rates for California and Texas in the first quarter of 2018 shows Texas’ ongoing advantage over California and helps to explain why the level of poverty in the Lone Star State is far lower in every demographic category:
California holds itself out as America’s progressive template: high taxes, comprehensive regulations, and generous welfare benefits. It encourages immigration, both legal and illegal, with the state effectively being a sanctuary state. Yet, in spite of (or because of) its policies, California has America’s highest poverty rates.
In contrast, Texas works. With a population just as diverse as California’s, Texas’ policies produce a more prosperous people who, across similar demographic groups, are 27% less likely to suffer from poverty than their California cousins.