Where you live has a huge effect on how much purchasing power your dollar has—and how far your paycheck truly goes.
The average rent for a two-bedroom apartment in San Francisco was $4,690 in April. In Dallas, a similarly sized place would set a renter back $1,433 a month, less than one-third the cost in the City by the Bay.
Renters in the lower third of median household income spend almost half of their income on housing, though federal rental assistance can reduce those costs for the poor. And at the state level, the out-of-pocket cost for housing varies enormously, with Hawaii’s costs, on average, coming in at more than three times the national average, while paying for shelter in Mississippi costs about 30% below the national average.
Oddly enough, the U.S. Census Bureau’s Official Poverty Measure takes no account of these regional differences in its flawed measure (which is based on a 1955 study of what it takes to feed, clothe and house a family on a subsistence diet). In 2019, the Census Bureau sets the poverty threshold at $25,750 for a family of four in the 48 contiguous states and the District of Columbia, with separate calculations of $32,190 for Alaska and $29,620 for Hawaii.
Using this unadjusted poverty threshold, Census estimated that 12.9% of Americans earned income below the poverty level as averaged in the three years from 2015 to 2017. Mississippi had the highest share of people in poverty, 19.5%. But Mississippi’s Official Poverty estimate doesn’t account for the fact that it’s also America’s least costly state in which to live.
The U.S. Bureau of Economic Analysis does publish annual Regional Price Parity estimates. This data estimates that costs in Hawaii are the highest in America, 18.5% above the national average, with Mississippi’s indexed costs being the lowest, about 14.3% below the national average. But this government measure doesn’t count the portion of mortgage payments that reduce the principle amount on a loan. As a result, the Regional Price Parity calculation doesn’t truly measure the cash outlays needed to live in a state.
Even so, by applying the Regional Price Parity for housing costs and including an array of noncash benefits that aren’t considered in the Official Poverty Measure, such as food and housing assistance as well medical and work-related costs, the Census Bureau’s Supplemental Poverty Measure does account for some differences in the cost of living. By this, more comprehensive measure, California, not Mississippi, has the nation’s highest poverty level, 19% from 2015 to 2017, with Mississippi at 15.9% in comparison.
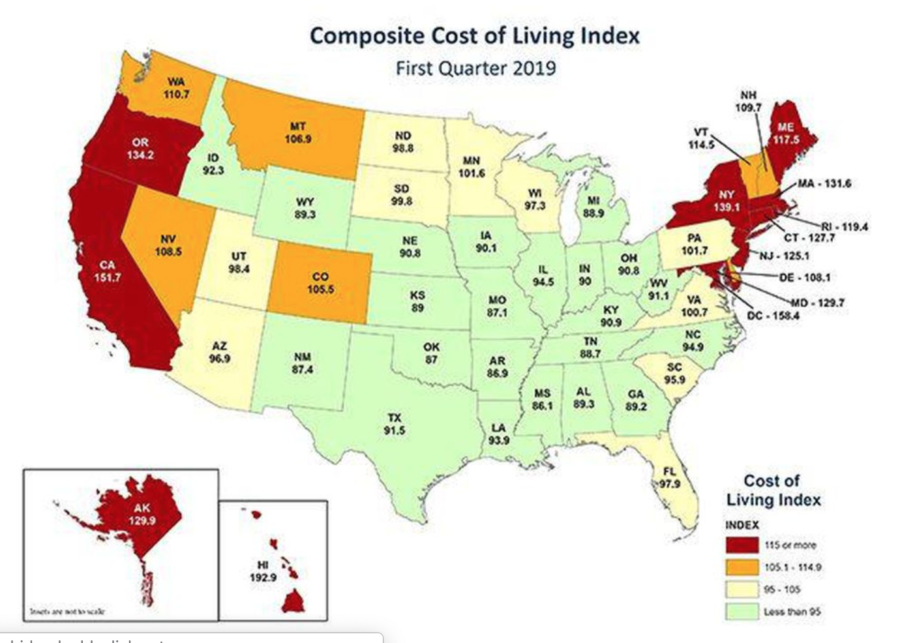
The nonprofit Council for Community & Economic Research (C2ER), using Census Bureau data and its own survey information, publishes a quarterly estimate of the cost of living for states and metropolitan areas. It shows even greater differences in the cost of living, with Hawaii estimated to cost about 92.9% above the national average in first quarter of 2019, and Mississippi coming in at 13.9% below the national average.
A practical example of how this matters can be seen when comparing minimum wage laws at the state level. California’s minimum wage is now $12 per hour for employers with 26 or more employees. In Mississippi, the minimum wage is effectively the federal minimum wage, $7.25 per hour. Applying California’s indexed cost of living in the first quarter of 2019, 151.7 (U.S.=100), to the state minimum wage yields an effective hourly wage of $7.90 per hour. Though in California, costs are generally far higher on the coast and lower the further away from the Pacific Ocean you get. In Mississippi, by comparison, a $7.25 minimum wage buys the equivalent of $8.42 in goods and services—about 7% more real buying power than in California.
Similarly, looking at the statewide average salaries for school teachers in 2016, as reported by the National Education Association, we see that average public school teacher pay was the highest in New York in 2016 at $79,637, followed by California at $78,711 with the national average at $58,950. But, applying the federal government’s Regional Price Parity to those salaries adjusts their buying power downward to $68,771 for New York and $68,564 for California. Using the C2ER cost of living estimate that looks at cash outlays, average teacher pay in New York buys an equivalent of goods and services of $57,252 in New York and $51,886 in California—both below the national average. In Texas, on the other hand, where the C2ER cost of living index is 91.5 (U.S.=100), the average teacher salary of $52,575 stretches to an equivalent of $57,459—close to the national average and affording teachers in the Lone Star State greater buying power than their peers in either New York or California.
Why are there such large cost of living differences around the nation? Economics, weather and amenities explain some of it. So, too, do local regulations, taxes, and restrictive zoning that act to create artificial scarcity in the housing market, driving up the cost of rents and home values. Thus, state and local political factors can act to make housing up to 50% more costly, eating into the earnings of average Americans.